Basketball Stat Abbreviations: FG, REB, AST, +/- and More
That row of abbreviations, decoded
Scoresheets, score apps and broadcast graphics use the same English abbreviations everywhere, Chinese games included. All 14 of the common ones are below with what each actually counts and what it leaves out, followed by the rates worth more than shooting percentage.
Updated 8 Aug 2026
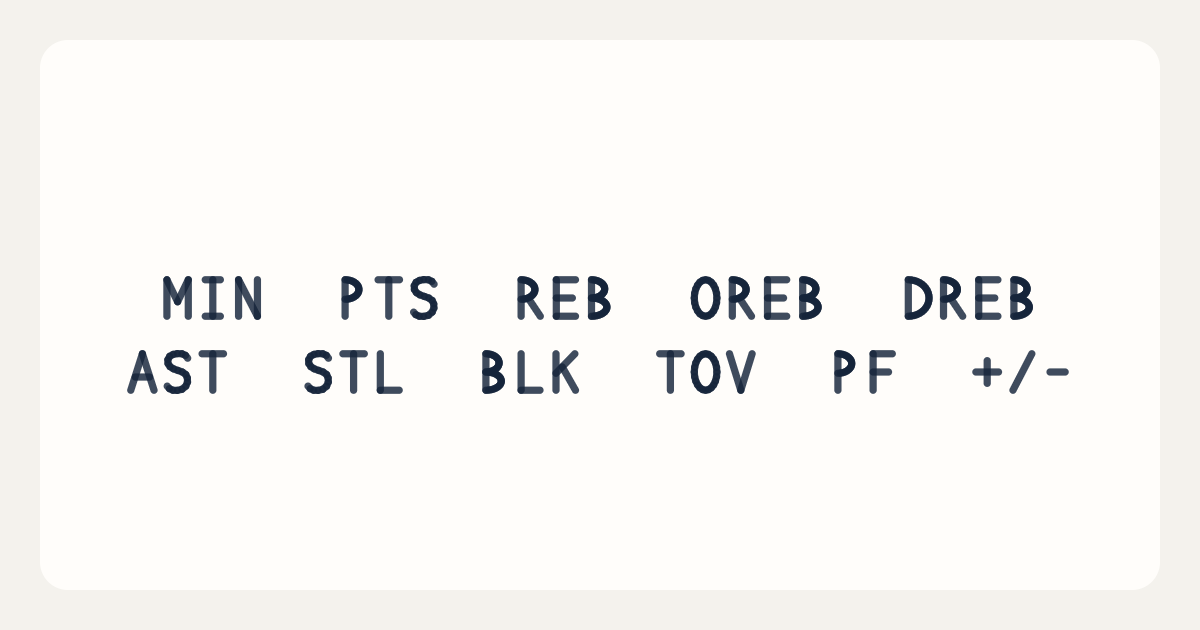
The row of column headings a box score prints. What each code stands for is spelled out on this page.
QUICK REFERENCE
The ten columns people look up most
One line each. Tap a code for that term’s own page, where the arithmetic, a worked example and what the number leaves out all live. How to read the whole sheet is below.
Quick reference for common box-score abbreviations: the code, its other spellings, the full term, and a one-line meaning
Your team’s points minus theirs over the minutes this player was on court.
Counting stats
Counted one event at a time. Learn these and you can read a scoresheet end to end.
MIN
Minutes played
Minutes actually on the floor, including time coming off the bench.
PTS
Points
Points this player scored, free throws included.
REB
Rebounds
Total boards taken, offensive plus defensive.
What it leaves outThe number depends on how well both teams shot. The better the other team shoots, the fewer defensive boards exist to take, so comparing totals across teams says little.
OREB
Offensive rebounds
Boards taken off your own team’s miss, which buy a fresh possession.
DREB
Defensive rebounds
Boards off the other team’s miss, which end their possession.
AST
Assists
The pass that leads directly to a teammate scoring.
What it leaves outIt is a judgment call, and scorers apply it differently from league to league. Comparing assist totals across competitions is shakier than it looks.
STL
Steals
Taking the ball off an opponent or out of a passing lane.
BLK
Blocks
Getting a hand on a shot after it is released.
What it leaves outNeither blocks nor steals measure defense. The best defense stops the shot or the pass from happening at all, and nothing that did not happen shows up in a column.
TO
Turnovers
Losing the ball without getting a shot off. Some sheets write it TOV.
PF
Personal fouls
Fouls charged to this player. Under FIBA rules five ends their game; the NBA allows six.
Shooting
Makes and attempts always travel together, written as makes-attempts. Reading the makes alone flatters everyone.
FGM-FGA
Field goals made and attempted
Every shot from the floor, twos and threes together, free throws excluded.
3PM-3PA
Three-pointers made and attempted
Shots from behind the arc, which are also counted inside FGM-FGA.
FTM-FTA
Free throws made and attempted
Attempts from the line, which never count towards FGA.
Impact
These try to answer whether the team is better with someone on the floor. How much they are worth depends entirely on sample size, and one game is not one.
+/-
Plus-minus
Your team’s points minus theirs, over the minutes this player was on court.
What it leaves outOver one game this is mostly noise: who else was on the floor matters more than the player did. A single game’s number is close to useless for judging anyone.
THE RATES
The numbers worth more than FG%
Shooting percentage answers how many went in, never whether the shots were worth taking. All five below can be worked out from the numbers already on the sheet.
FG%Field goal percentage
FGM ÷ FGA
The most quoted and the most misleading, because it prices a three and a layup the same. A shooter who only takes threes and one who only takes layups cannot be compared on it.
Rough scaleA team in competitive senior basketball sits around 45%.That is the FIBA and EuroLeague line; the NBA runs a little higher.
3P%Three-point percentage
3PM ÷ 3PA
Needs volume before it means anything. Two from three in one game is 67% and tells you nothing.
Rough scaleThirty-five per cent already counts as reliable shooting.
FT%Free throw percentage
FTM ÷ FTA
The only shot nobody defends, so it comes closest to measuring the stroke itself, and it is the one most worth practising on its own.
Rough scaleSeventy-five per cent is respectable; under 60 and teams will foul you on purpose late.
eFG%Effective field goal percentage
(FGM + 0.5 × 3PM) ÷ FGA
Credits the extra point a three is worth, so volume shooters stop being punished by FG%. Worth more than FG% every time.
Rough scaleAround 52% is solid.That is the FIBA and EuroLeague line; the NBA runs a little higher.
TS%True shooting percentage
PTS ÷ (2 × (FGA + 0.44 × FTA))
Folds free throws into the same measure, which makes it the most complete single number for scoring efficiency. The 0.44 estimates how many free-throw attempts actually ended a possession; it is an approximation, not an exact figure.
Rough scaleAround 55% is typical, and anything past 60 is genuinely efficient.That is the FIBA and EuroLeague line; the NBA runs about three points higher.
COMMONLY MISREAD
Four things people say that are wrong
What gets saidWhoever scored most played best.
What is actually trueCheck how many shots it took. Twenty points on 22 attempts and twenty on 11 are different games, and TS% exists to tell them apart.
What gets saidLots of steals and blocks means good defense.
What is actually trueBoth only record the gambles that worked. The steadiest defense stops the shot or the pass from ever happening, and none of that reaches a stat sheet.
What gets saidMore rebounds means the team worked harder.
What is actually trueHow many boards exist to take depends on how both teams shot. If the other team shoots well, there are fewer defensive rebounds to get. Compare rebound rate, not totals.
What gets saidMinus fifteen tonight, so they were the problem.
What is actually trueOne game of plus-minus is almost all noise, because who else was out there swings it more than the player does. It needs dozens of games before it starts meaning anything.
READ NEXT
The rules behind the numbers
Several columns are rules in disguise. How many free throws appear depends on where the team foul count had reached, and the personal foul column stops growing at five.